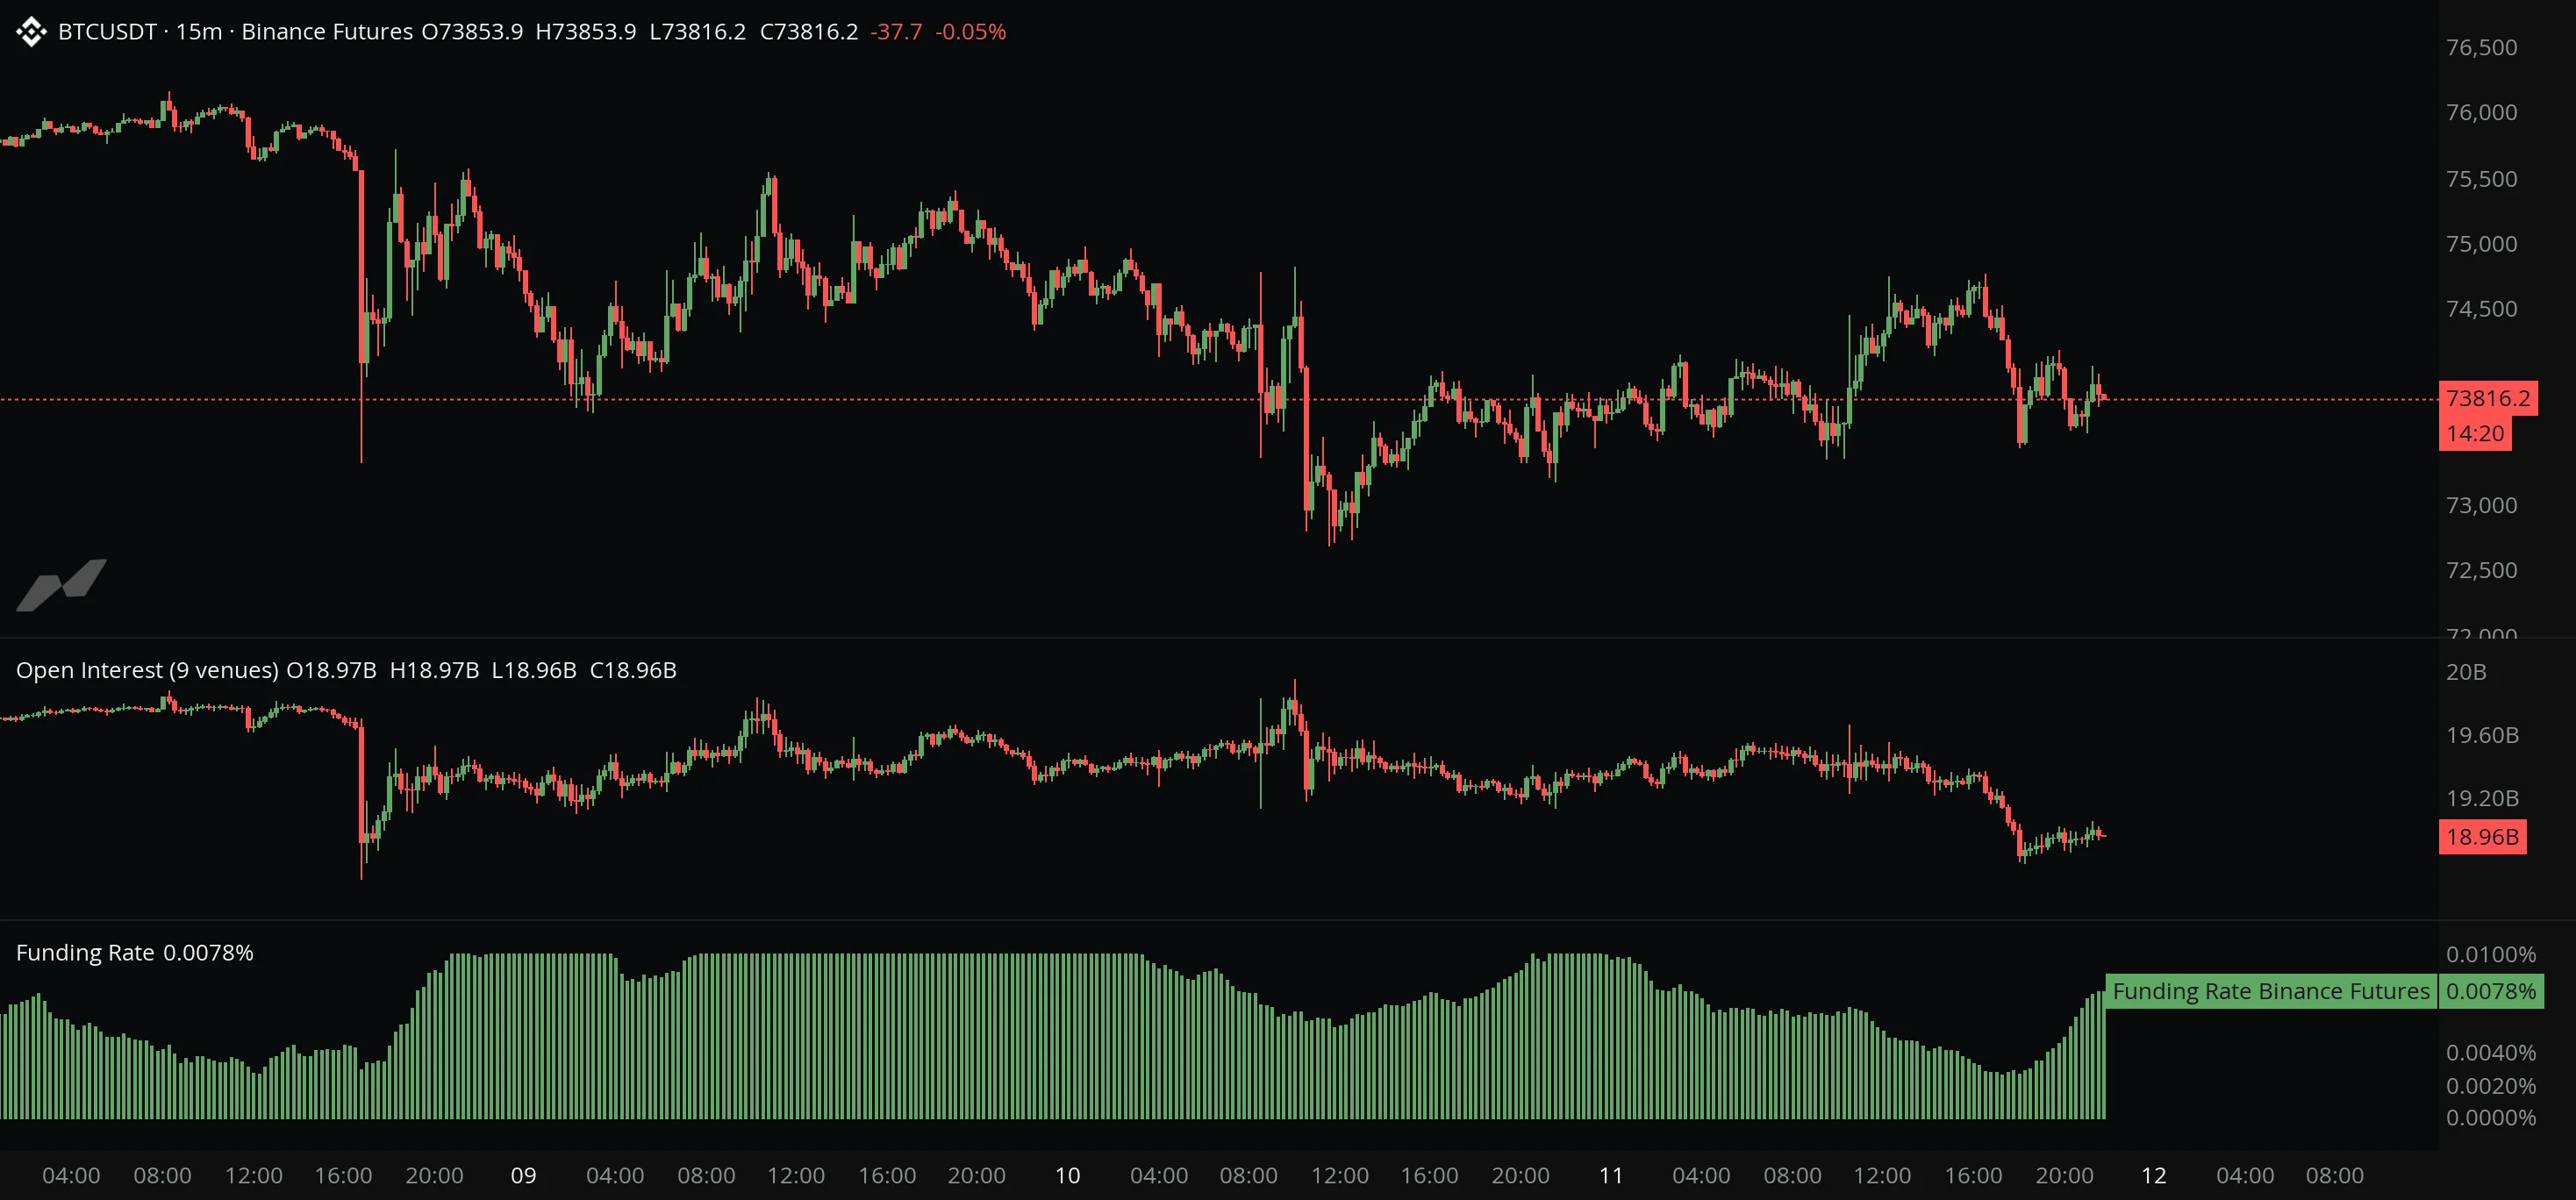
Funding rate
What longs and shorts are paying to hold, as a histogram or line under the chart, aggregated across venues.
Derivatives
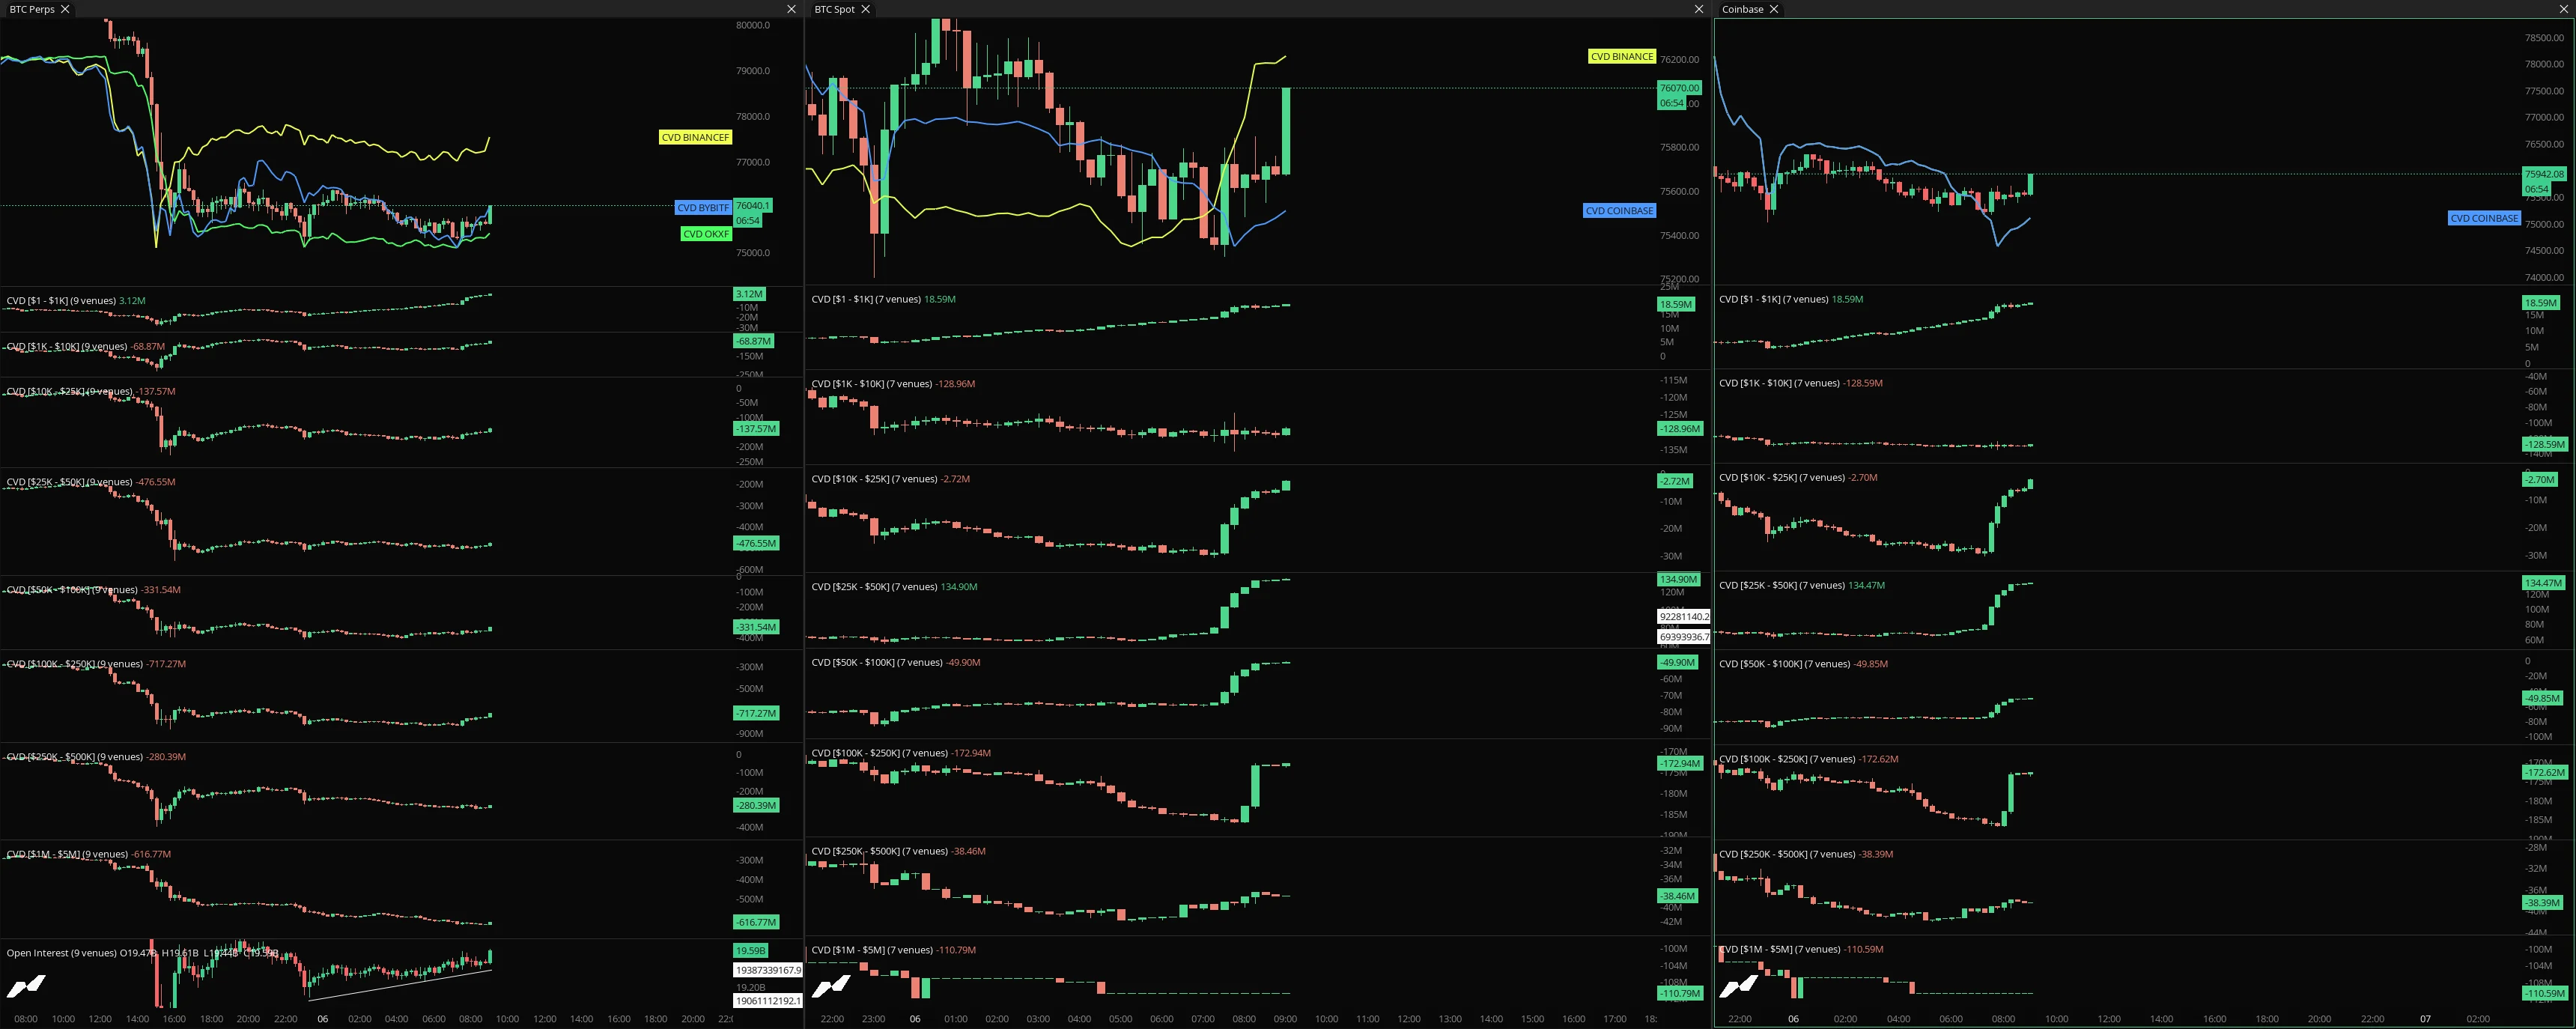
Derivatives data shows how traders are positioned and when those positions get forced out. MMT charts open interest, funding, liquidations and net positioning next to price, adds Hyperliquid OI footprints, aggregated across futures and coin perps.
Track how many contracts are open, and watch positions build or unwind.
Open interest in USD or contract values, aggregated across futures and coin perps.
What longs and shorts are paying to hold, as a histogram or line under the chart, aggregated across venues.
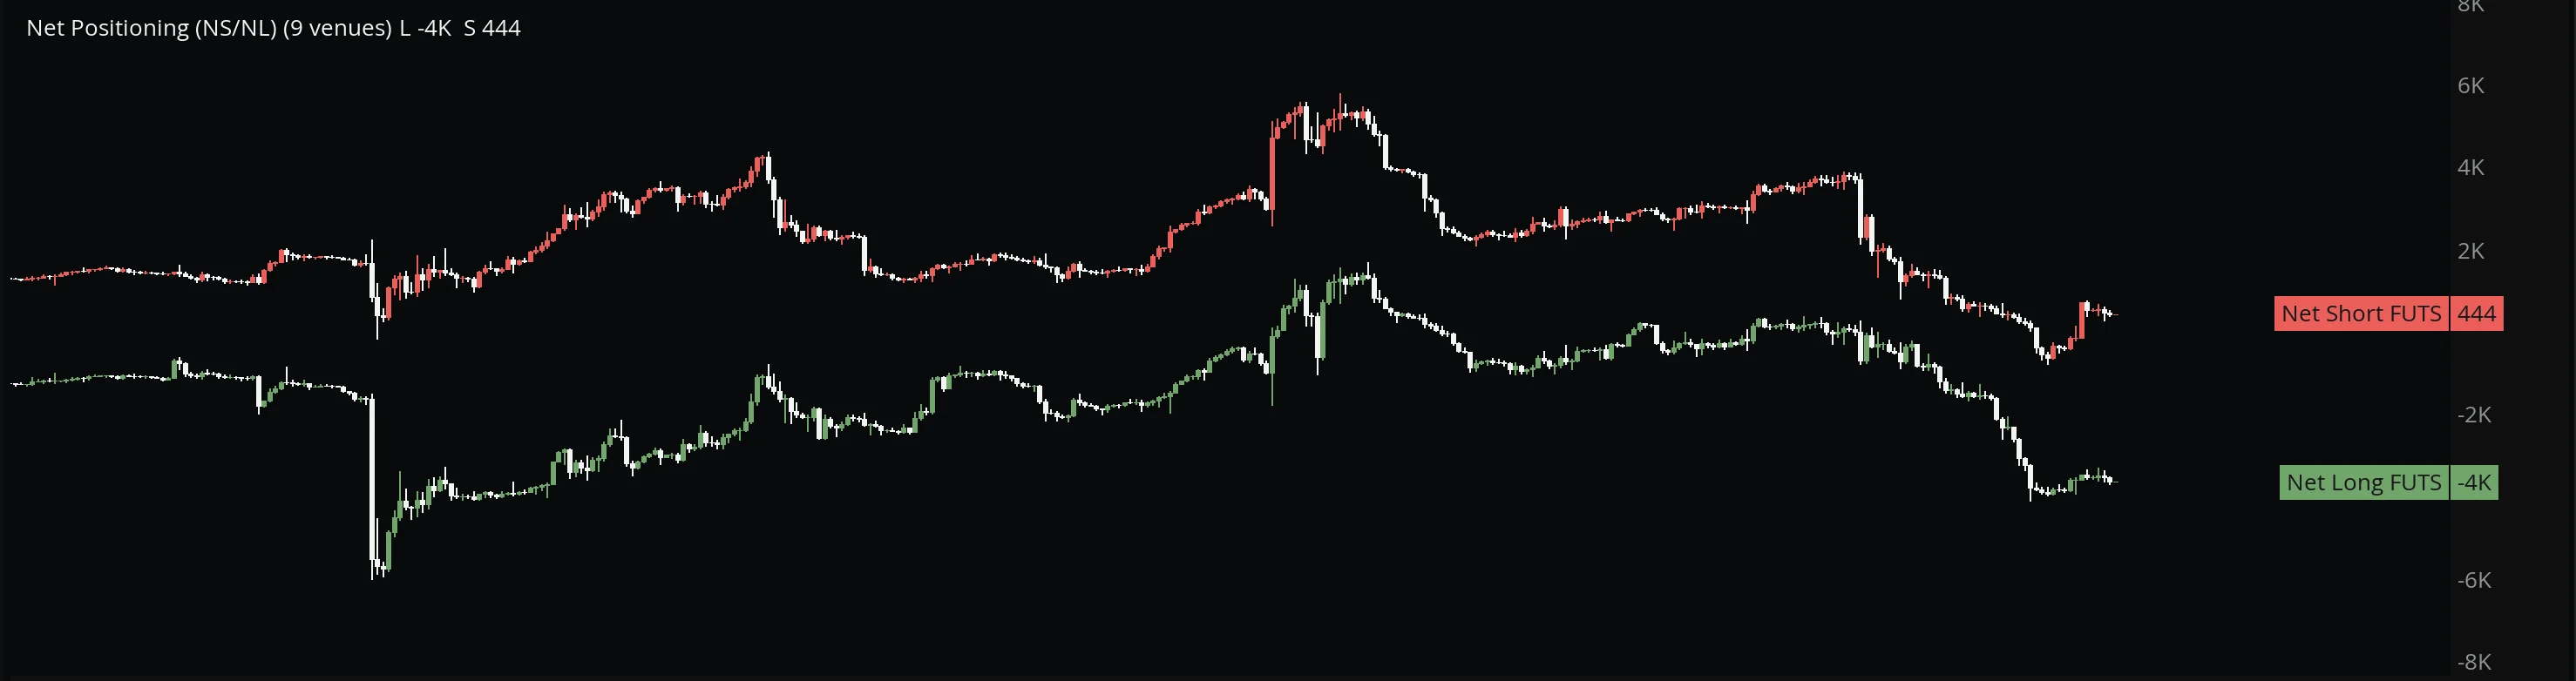
Net longs, net shorts or the delta between them, with an only-new-positions filter and absorption flags.
Mark where positions got forced out, on the chart and in a live feed.
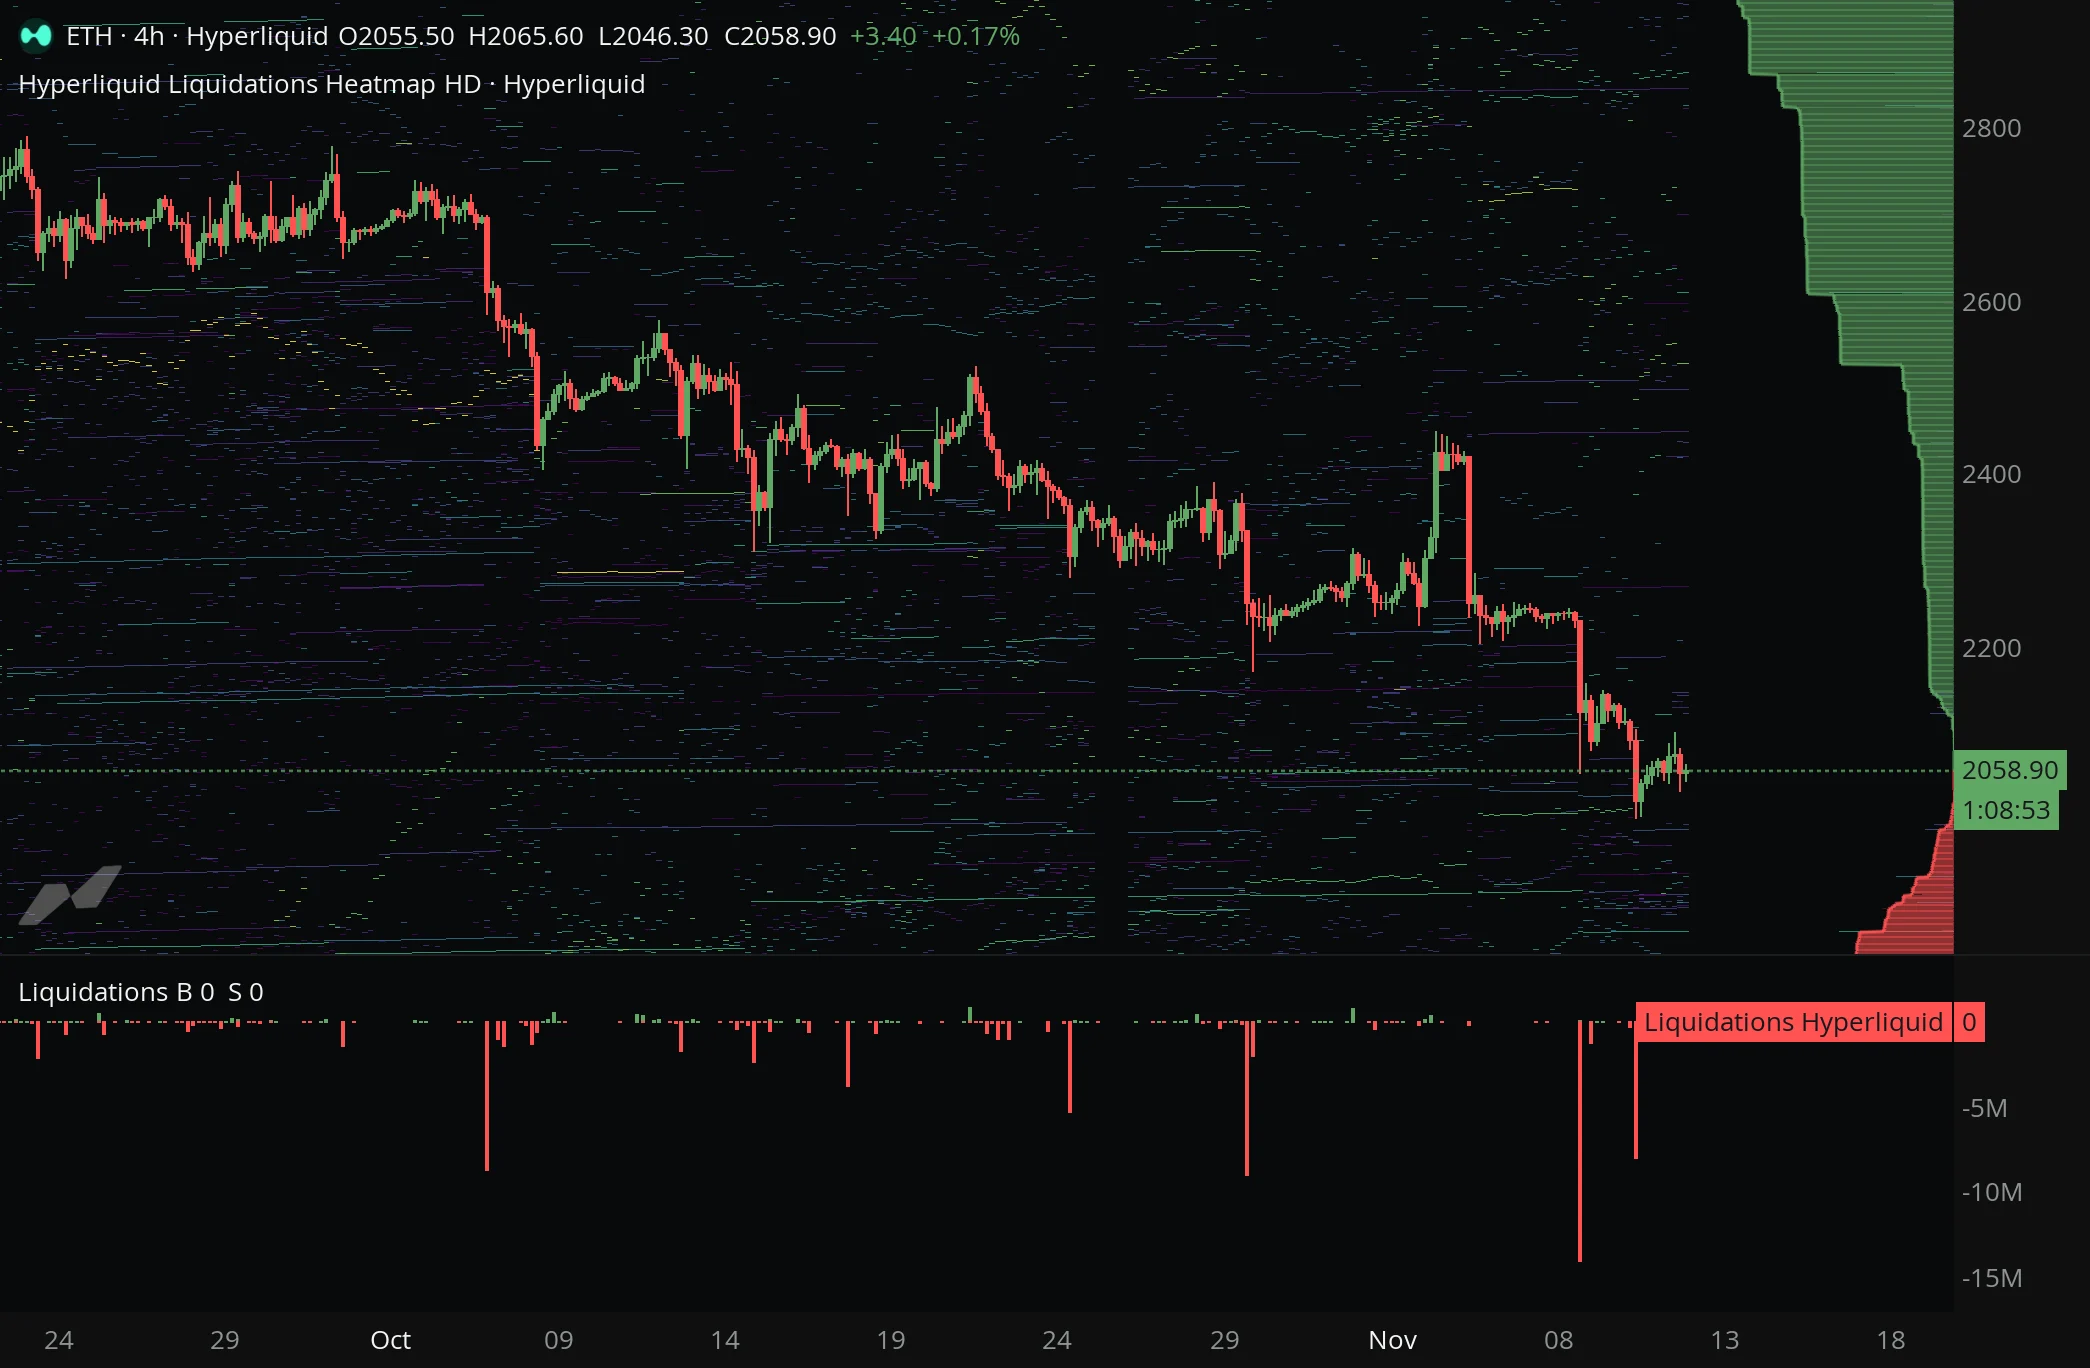
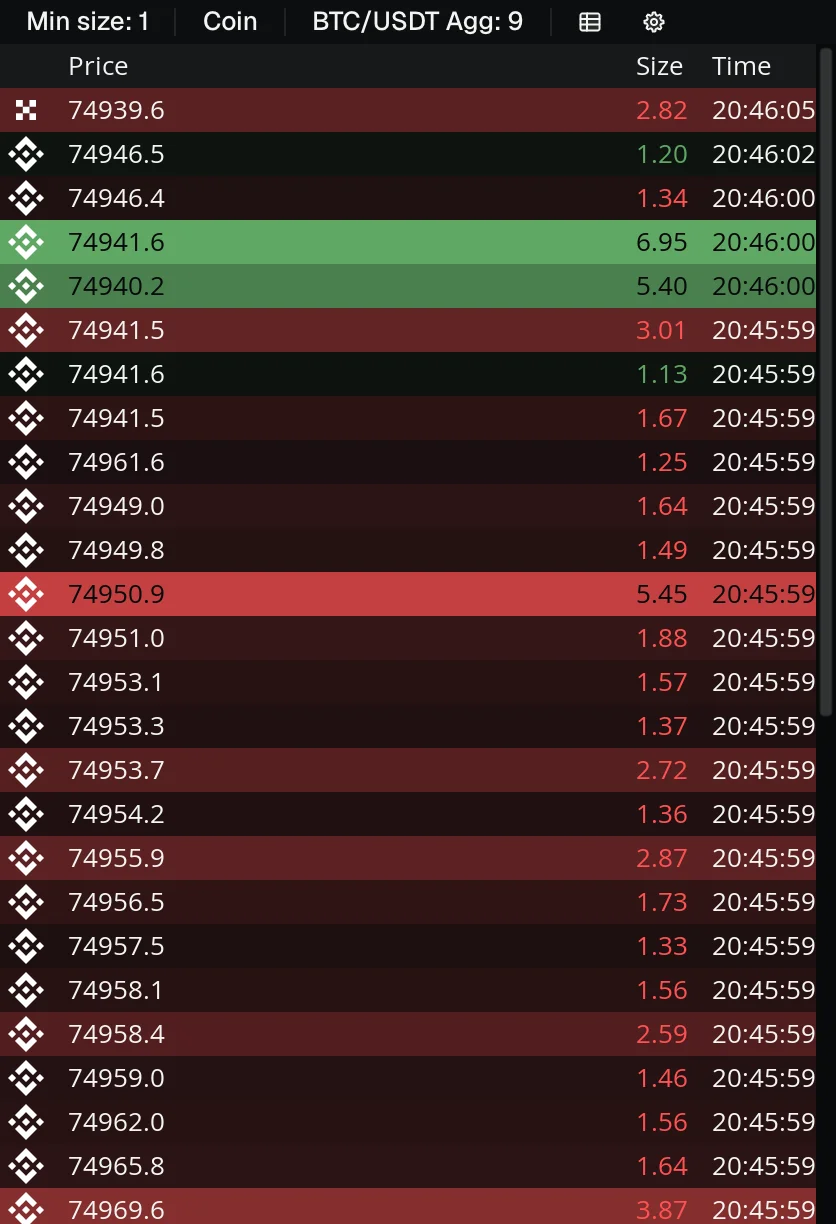
Long and short liquidations per bar, with a threshold colour that flags large ones.
Up to 512 recent liquidations across aggregated markets, with venue logos and a minimum-size filter.
Four alert levels on large liquidations, from $50K to $2.5M. Futures and coin perps.
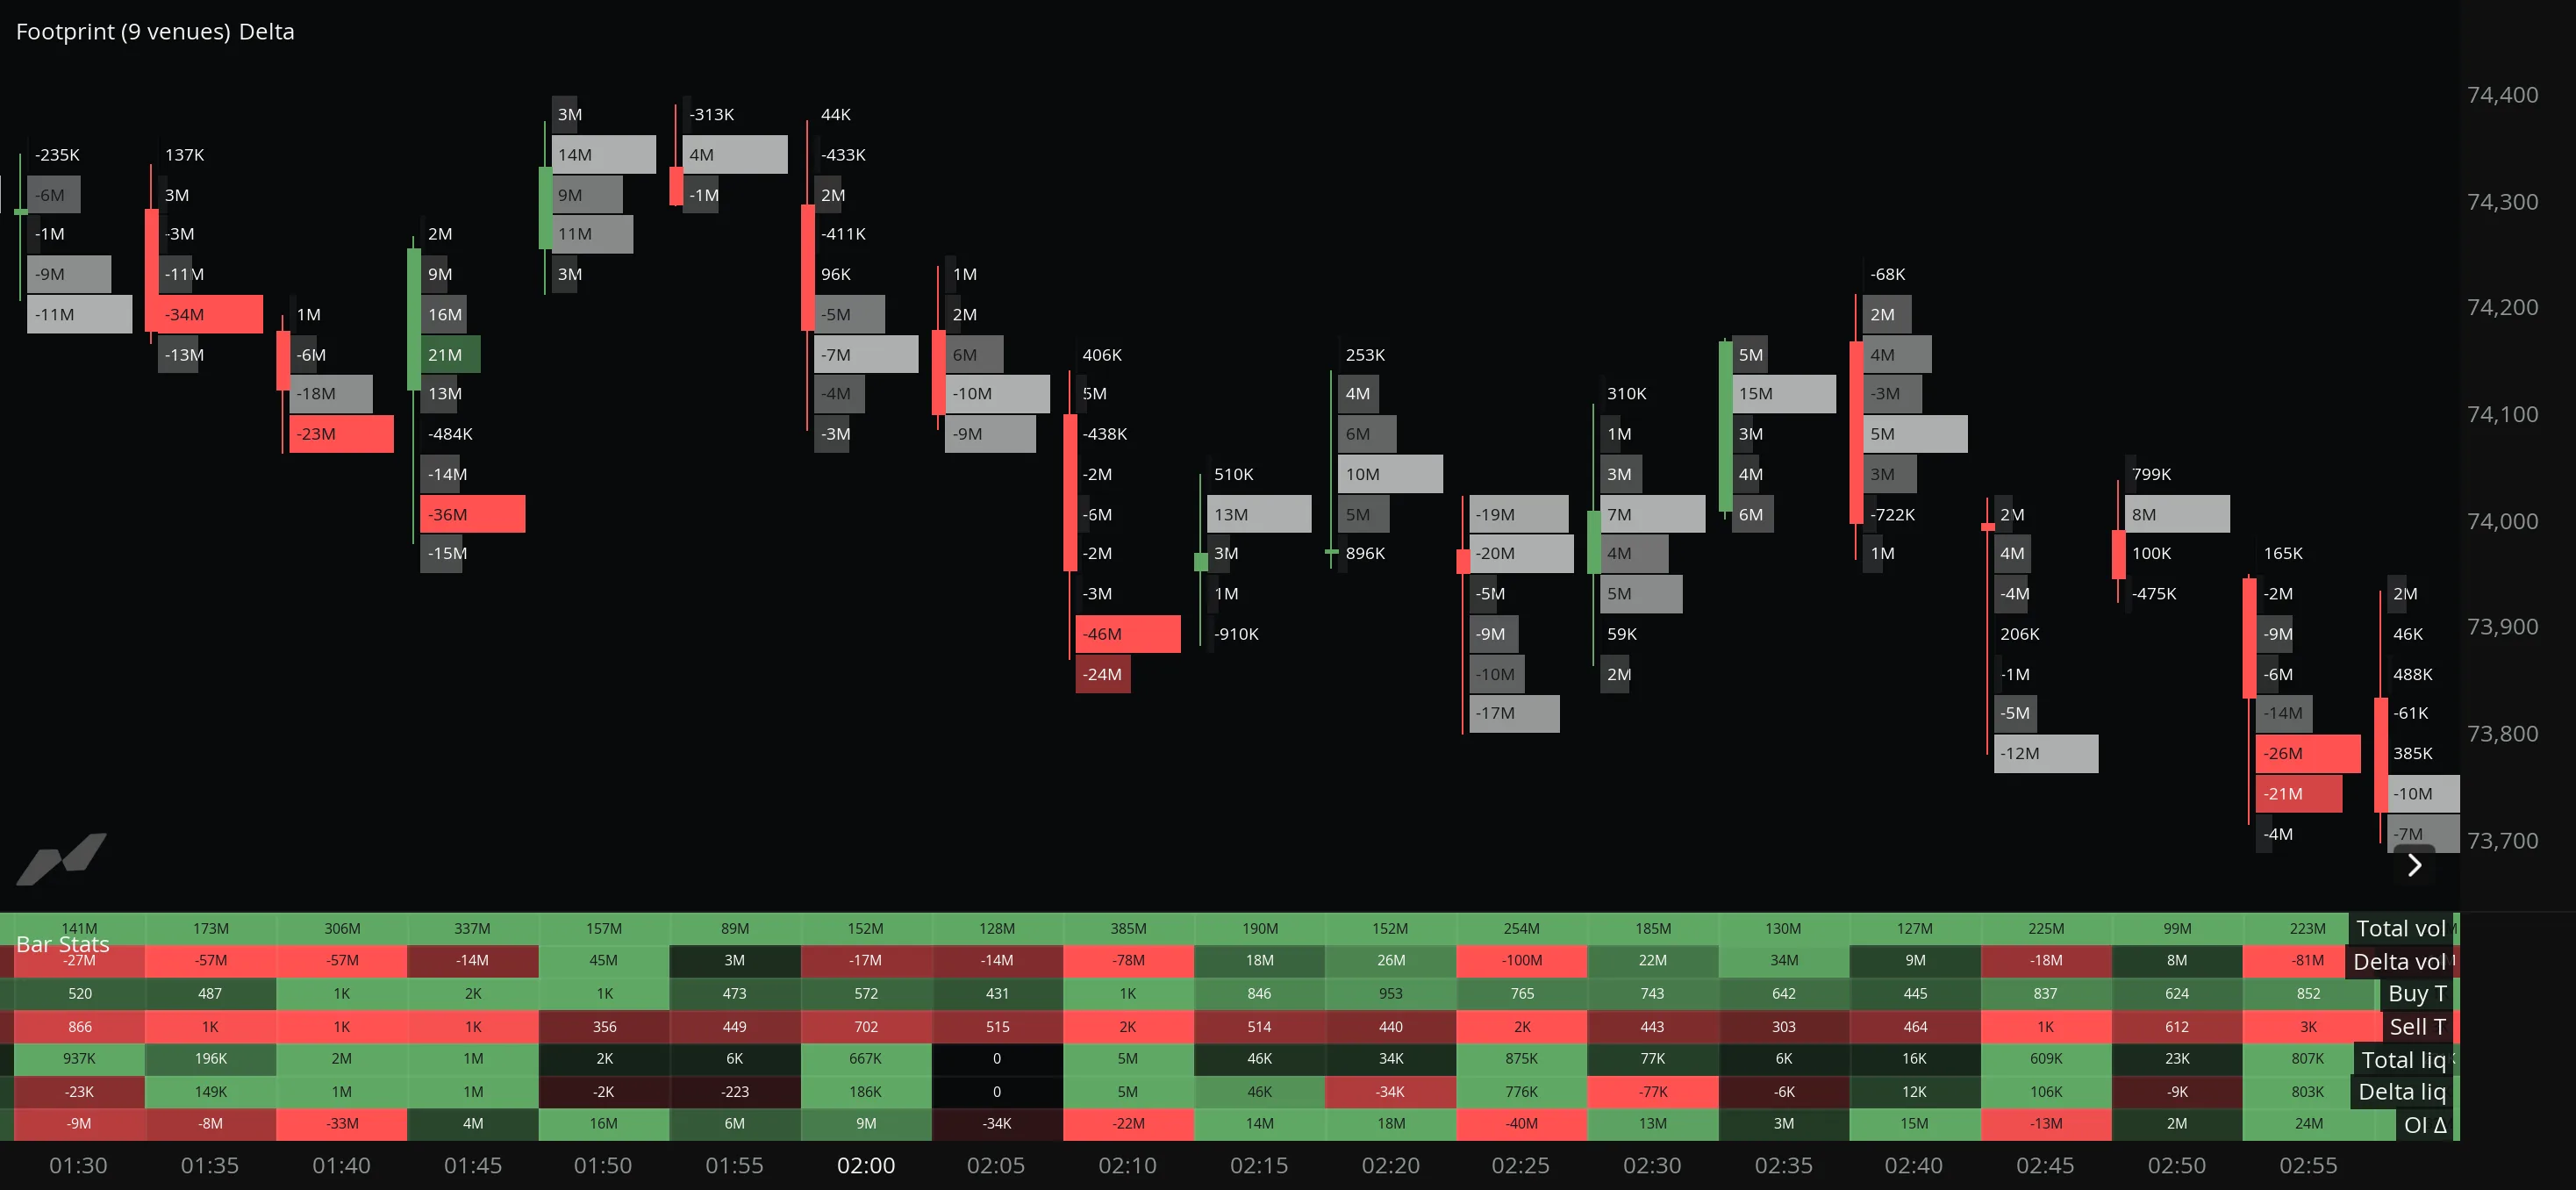
Read Hyperliquid positioning inside every bar.
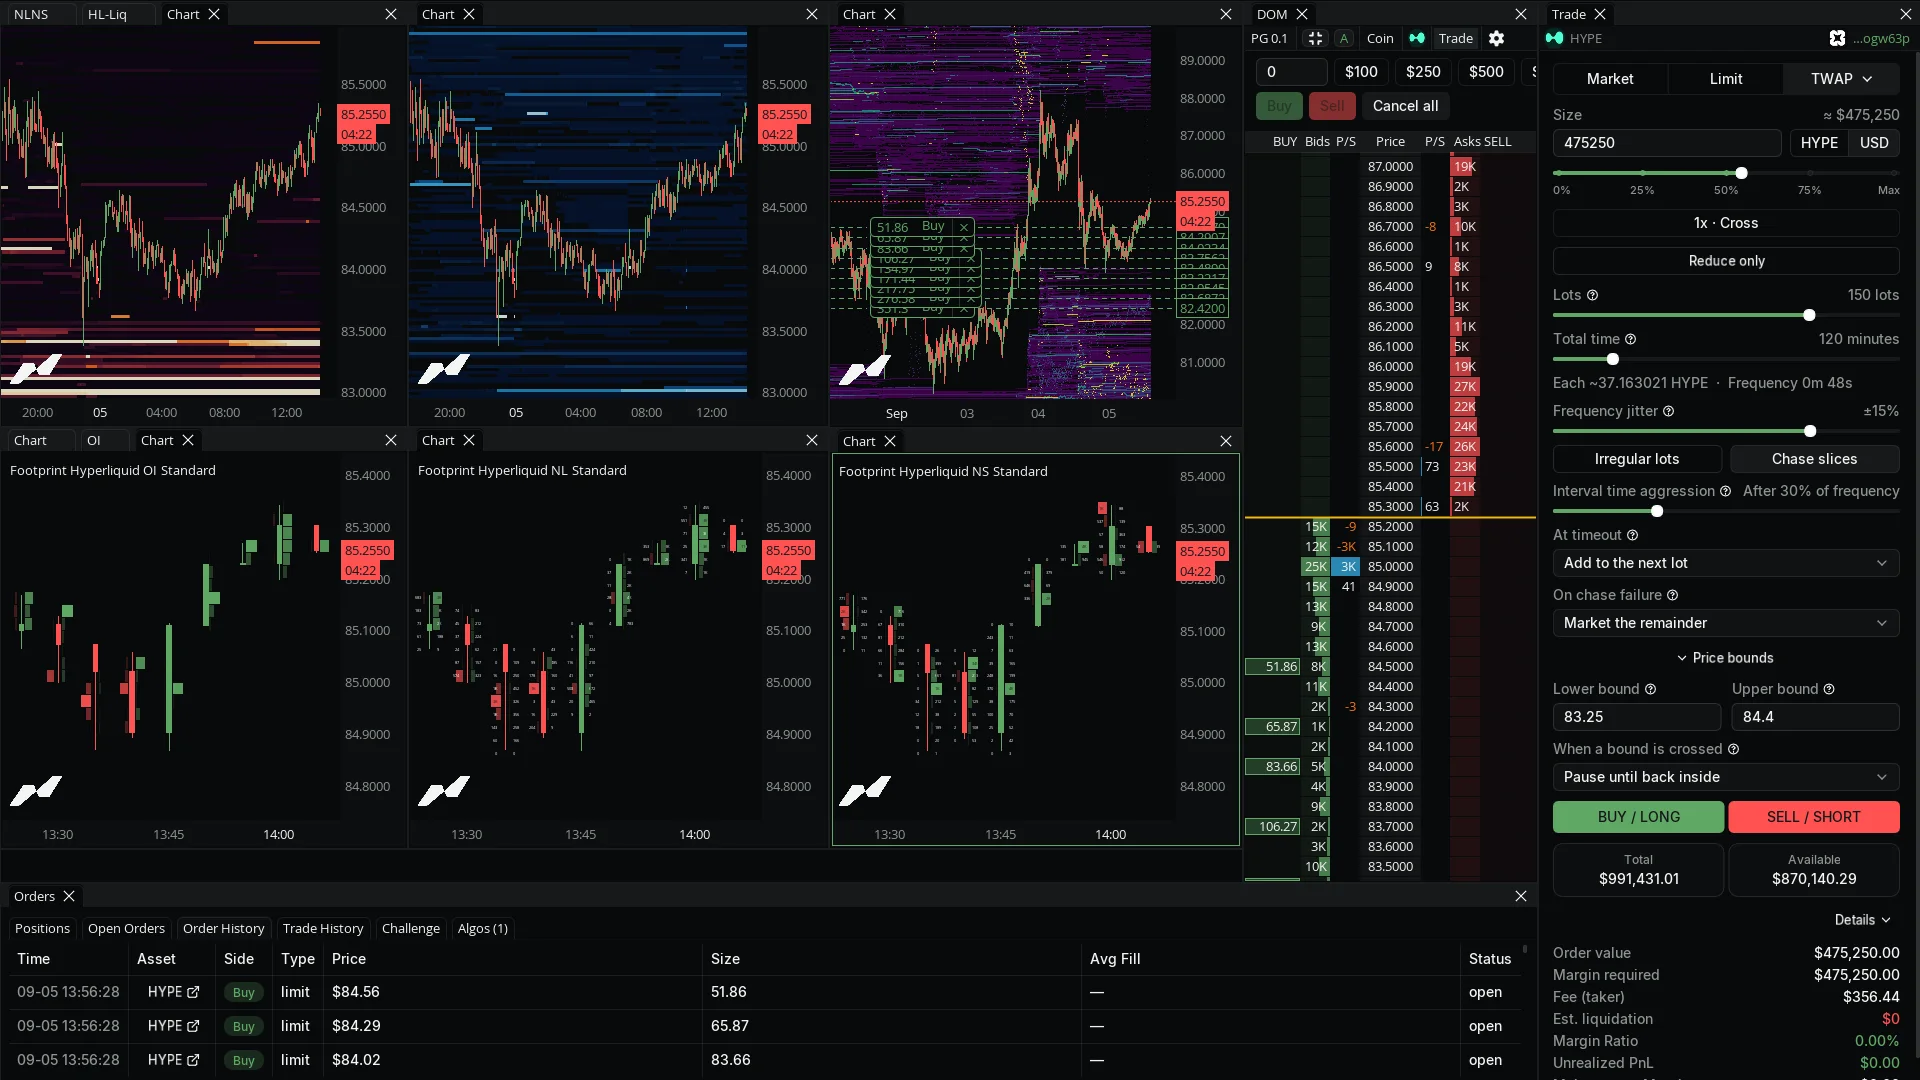
Open-interest, net-long and net-short footprints from Hyperliquid-only sources, in cluster or profile display. Pro and up.
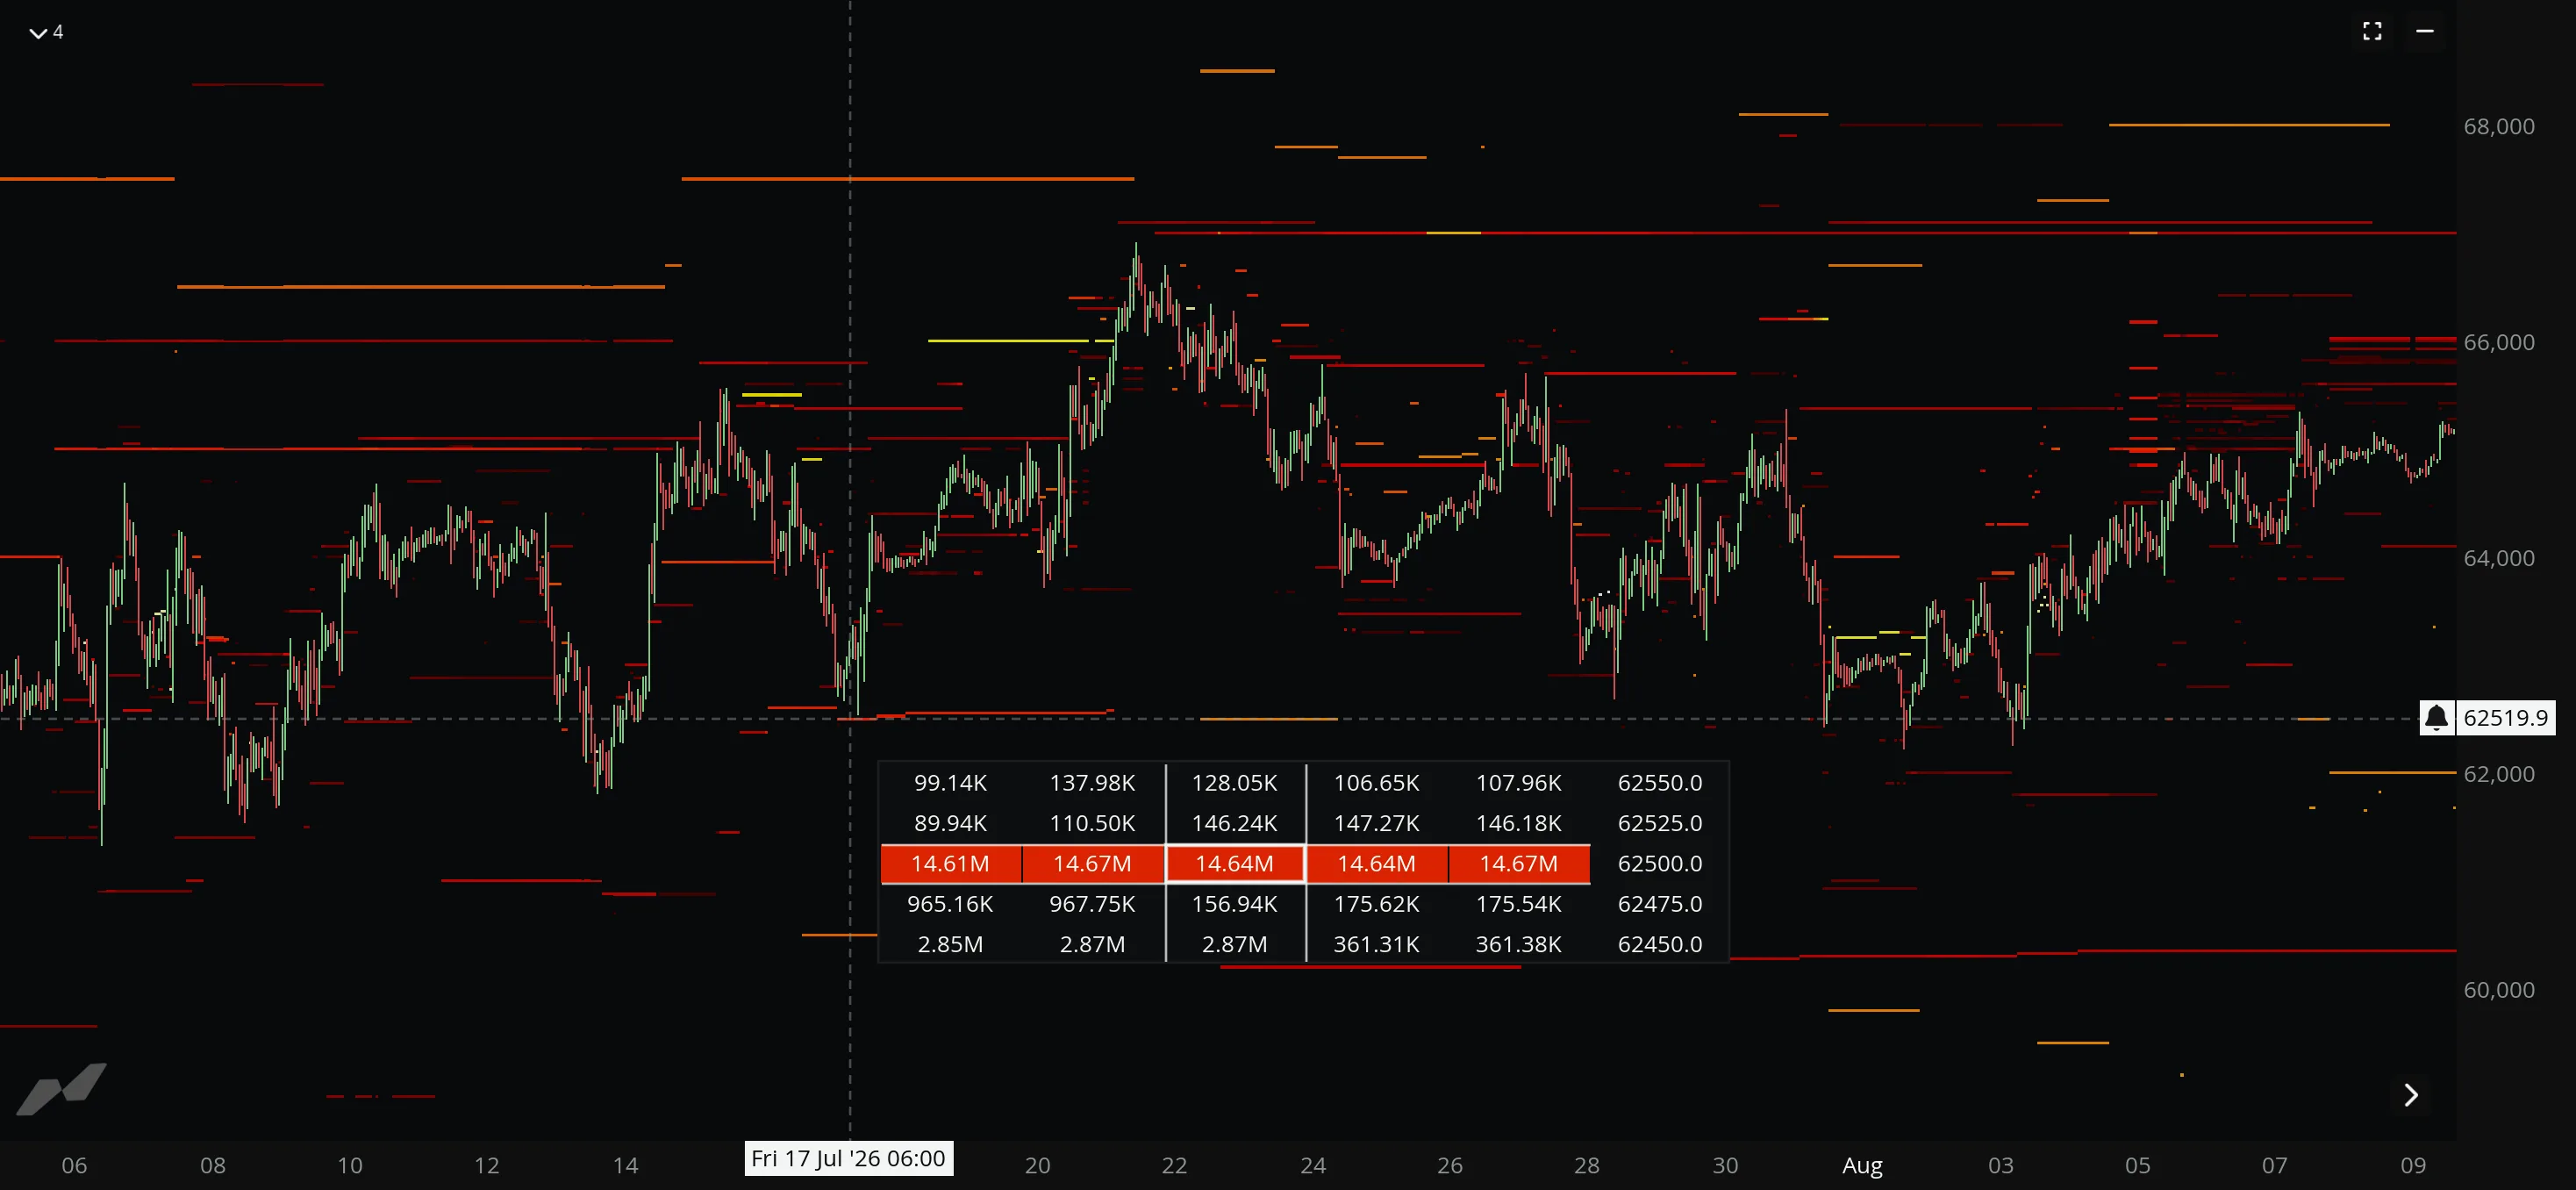
The Hyperliquid stop, take-profit and liquidation maps are onLiquidity
All of it painted on your chart next to price, not buried in a separate dashboard, merged across futures and coin-perp venues.
“I have to admit that MMT is mogging every other competitor, and by far.”
“The innovation at MMT is unparalleled.”
200K+ traders on MMT.
More on XStart free with no card. Upgrade only when you hit a limit.
$0/mo
forever free
Kick the tires. No credit card.
$69/mo
Billed monthly
For traders who take this seriously
$99/mo
Billed monthly
Enhanced edge & increased limits.
Pay with cryptoAnnual plans available via USDC or USDT.
Open interest is the total number of derivative contracts currently open. Rising OI means new positions are being added, and falling OI means positions are closing. MMT charts it across futures and coin perps.
MMT reads liquidation events from each exchange's feed and merges them into one view, on the chart and in a live feed. You can filter by size and set audio alerts on large ones.
Net positioning shows whether the market is net long or net short, with modes for delta, net long, net short, and both. It can also flag absorption, where new positions get soaked up without moving price.
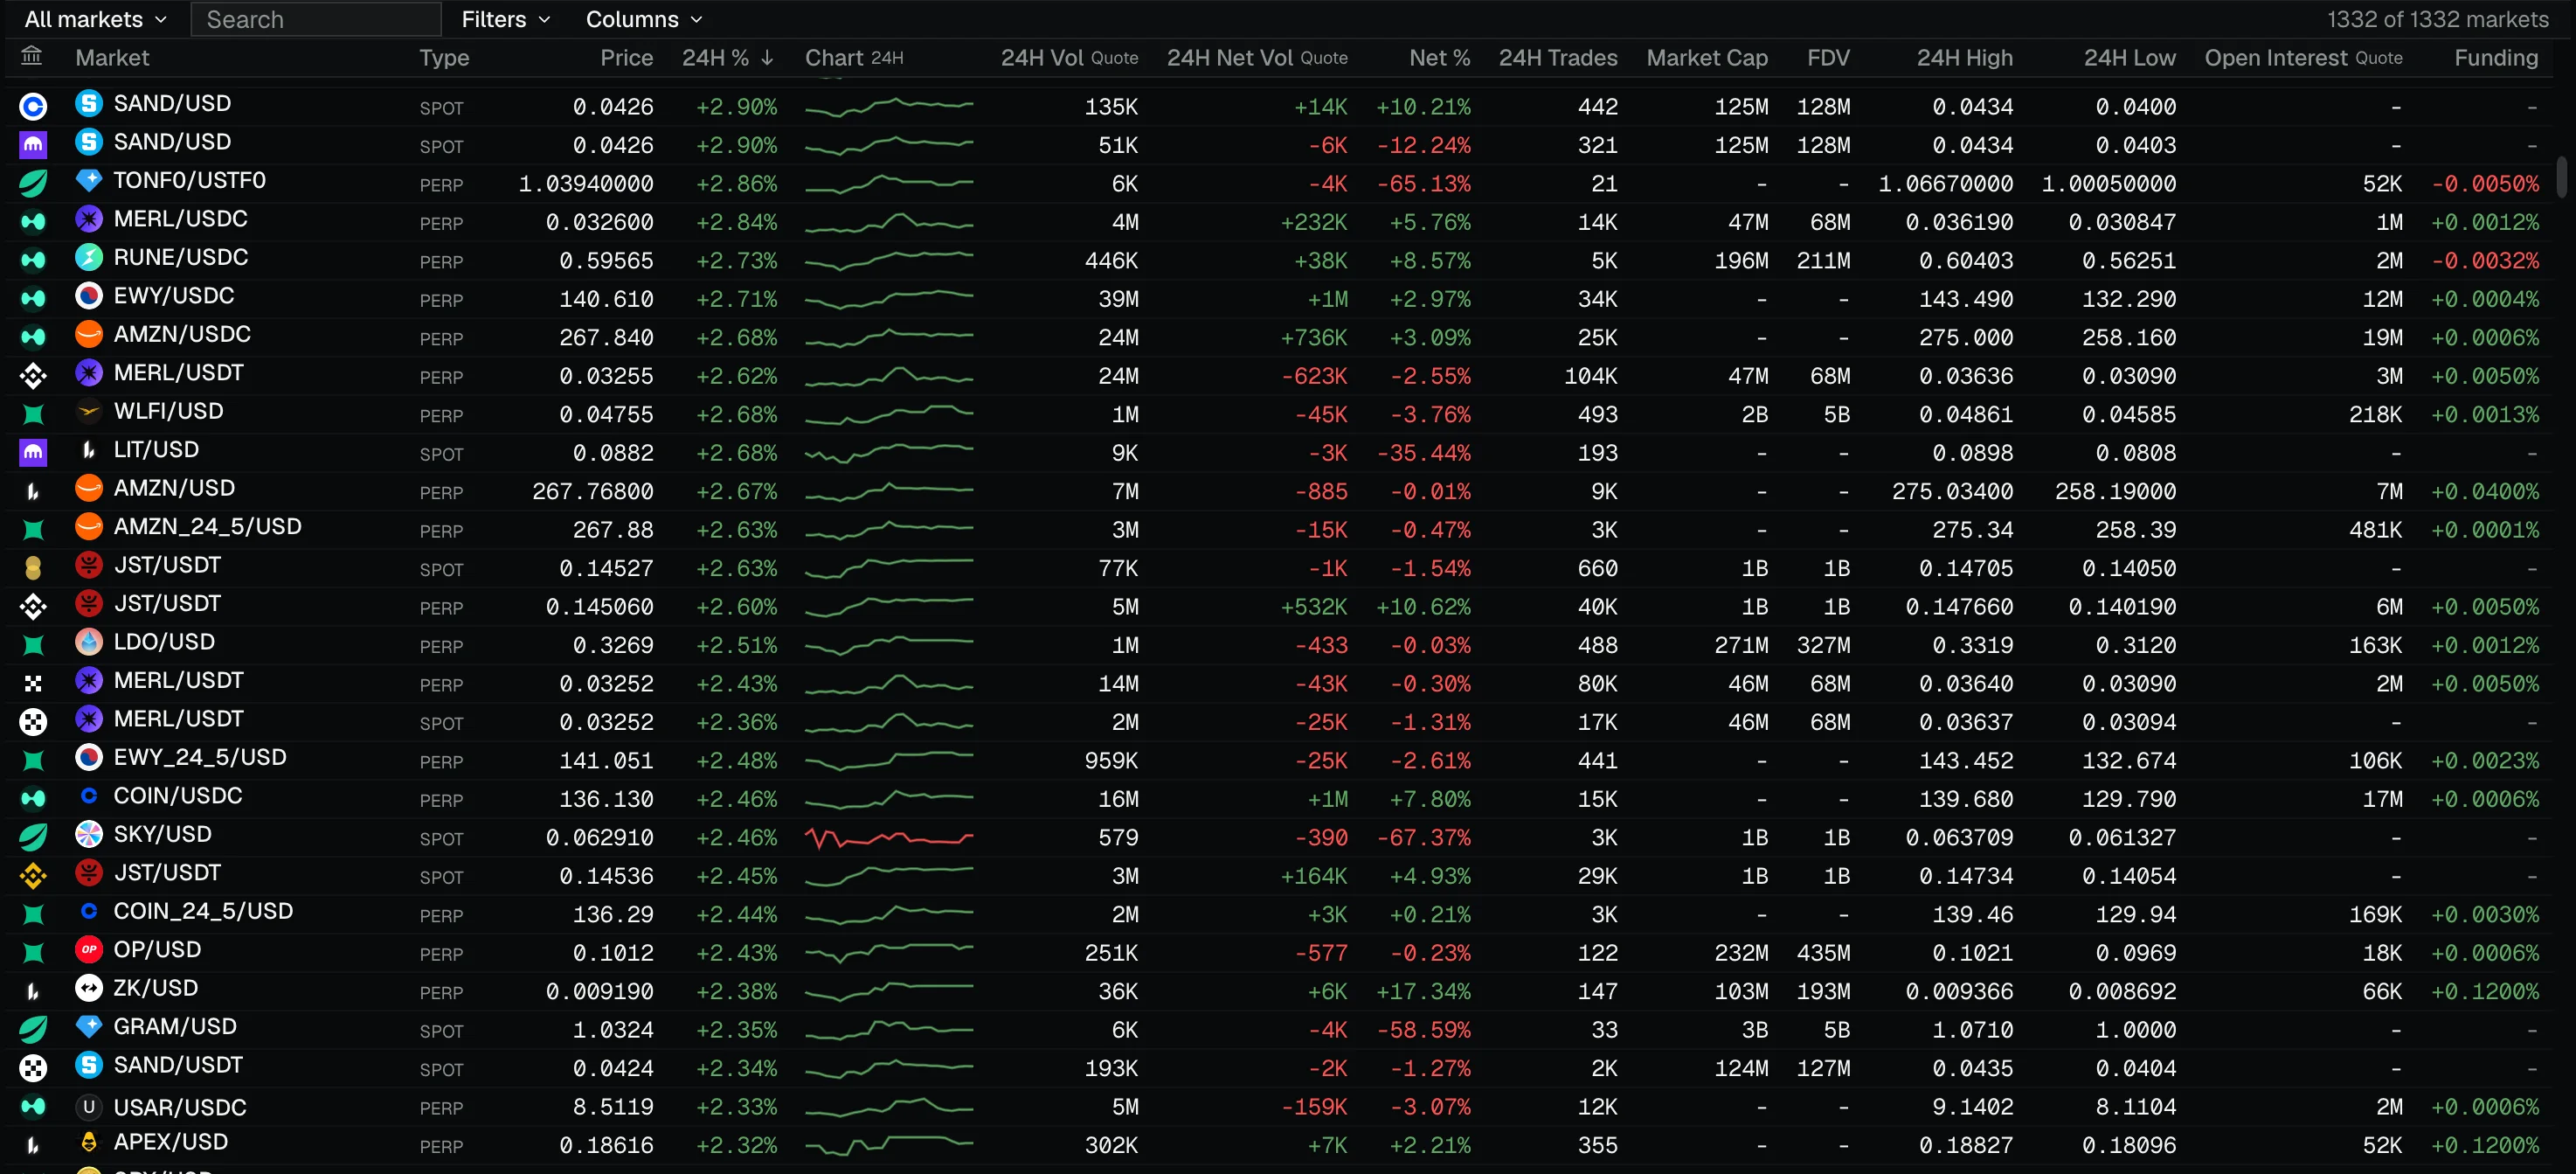
Derivatives data covers futures and coin perps across 20+ exchanges. Open interest, funding, liquidations, and net positioning are on the Free plan.
Free forever. No credit card.